
Comparison of Four Treatment Methods for the Removal of Lipids and Food Waste in a Grease Trap Environment
Introduction
by Scott A. Lowry
Environmental Science Department
Texas Christian University
Ft. Worth, Texas

Bioremediation, as it was first termed, is the degradation of more complex hydrocarbons into carbon dioxide, water, and other simpler products by microorganisms including bacteria, fungi, cyanobacteria, and algae. Bioaugmentation is the addition of bacterial cultural products containing different strains of microorganisms to wastewater with the purpose of providing a sufficient quantity and diversity of microorganisms which can help improve the treatment performance of the wastewater treatment system (Yu and Hung, 1992). The breakdown of hydrocarbons by bacteria was first noted by Claude E. ZoBell in 1946 (Atlas, 1981). Microorganisms use the energy and carbon building blocks of the hydrocarbons to generate more cells. Bacteria also need nutrients like phosphorus and nitrogen, as well as certain other environmental requirements such as oxygen, water, pH, and suitable temperature to continue cell division (Severn and Adams, 1992). The process of converting the hydrocarbons to biomass and carbon dioxide is an oxidative one and is called mineralization (Atlas, 1984).
It has been well documented that many different species of bacteria are capable of utilizing hydrocarbons as their sole food source, and that these microorganisms are widely distributed in nature. Microorganisms have been found degrading hydrocarbons in extreme temperatures, such as the Antarctic and in hot springs (Atlas,1981). Most of the knowledge regarding the utilization of fatty acids as sole carbon sources stems from genetic and biochemical studies performed with E. coil (Nunn, 1986). The ability of microorganisms to biodegrade hydrocarbons is determined by contaminant concentration and the bacteria’s preexisting exposure to that specific hydrocarbon or group of hydrocarbons (Spain et al., 1980). In other words, when microorganisms are exposed to contaminants over a period of time, they tend to mutate (due to their rapid cell division) to a strain of microorganism that is capable of utilizing the contaminant as an energy source.
Numerous bioremediation studies, mostly related to petroleum hydrocarbon contamination, have been performed since Zobell’s discovery in the mid-1940’s. In the past, scientists have given particular interest to terrestrial and ocean hydrocarbon spills (Vance, 1991; Watwood et al, 1991; Song and Bartha, 1990; Bossert et al, 1984; Heitkamp and Cerniglia, 1988; Wiggins et al, 1987). It was not, however, until the Exxon Valdez supertanker spill on Bligh Reef, Prince William Sound, Alaska in March 1989 that the public became aware of the clean-up possibilities that bioremediation presented during the largest-scale bioremediation project ever conducted (EPA, 1991).
Although scientists have focused most of their attention on remediation of petroleum-based hydrocarbons in certain environments, there is another relatively new pollution problem to which the science of bioremediation may successfully be applied. This new pollution problem is forcing a strain on older or smaller waste water treatment plants. Many of the treatment facilities today are not capable of keeping up with the increased waste loads that are being produced by rapidly growing industry, specifically restaurants and car washes, or any establishment where food waste, animal waste, or detergents are produced and released into sewer systems. Additionally, ever-changing regulations and directives may make yesterday’s process unacceptable today. An area of increasing regulation and tighter enforcement is industrial process wastewater, especially that which is discharged into municipal wastewater treatment plants (Editorial Staff, 1993). Maybe the most promising means of meeting regulated limits is to pretreat wastewater on-site before it is discharged into the sewer. This is especially true for food serving establishments because there are a multitude of them producing large quantities of wastewater that the local wastewater treatment facility has to manage. By reducing BOD, TSS, NH3, NO3- and overall sludge volume reaching the treatment plant, costs to treat the polluted water could be significantly reduced, and the life of the treatment plant extended. Pretreatment utilizing proven bioremediation techniques could also reduce line constriction and clogging, saving cities cleanup costs (Grubbs, 1986).
The three main components of general organic wastewater are carbohydrates, proteins and lipids (Yu and Hung, 1992). Most of the grease and oil hydrocarbons in a grease trap exists as triglycerides and free fatty adds with carbon chain links 10-18 carbons long, (Grubbs, 1991). The process of mineralization begins when bacteria exude lipase, cleaving individual triglyceride lipid molecules into glycerol and three free fatty acids.

The structural formula of a triglyceride with palmitic acid, stearic acid, and oleic acid constituents (Atlas, 1984)
The glycerol molecule can now be metabolized to form products that can enter the metabolic pathway. Via beta-oxidation the fatty add portion of the lipid molecule is broken down two carbons at a time into two-carbon acetyl CoA units that can now enter the Krebs cycle (Atlas, 1984).
There is a question, however, of what to do with lipids (fats, oil, and grease) and the gray or dirty rinse water leaving restaurants, fast food outlets, hospitals, schools, car washes and any establishment where there is a kitchen and food is served, and where detergents or soaps are released into the sewer system. Today, most cities require that grease traps be installed by the food serving establishment. Grease trap is the general term used to describe a holding tank that separates grease, oil and settleable solids from gray water leaving a restaurant. The volume of effluent leaving the restaurant determines the size and shape of the grease trap. The food particles or settleable solids accumulate on the floor of the trap, while grease and oil coagulate on the top of the water in the first baffled compartment of the grease trap. This allows more clarified water to be discharged out of the trap and into the main sewer line.
Grease traps work fairly well as long as they are cleaned out in a timely fashion. The problem, however, is that unless someone is checking the trap daily or weekly, one often does not know when to pump the trap. This allows the grease and oil to build up to a point where it begins to spill into the sewer lines, first causing constriction and reduced flow, and eventually clogs and back-ups of the system. Correcting this problem is time consuming and expensive to restaurants and city sewer authorities. If it can be determined who is responsible for the clog, a fine will often be assessed. A surcharge can also be levied against restaurants and car washes.
The charge is determined based on the metered volume of water the establishment uses, multiplied by the BOD or TSS in pounds, times the BOD or TSS charge (Ford, 1994). Another problem with grease traps is odor. When grease and oil build up over the entire storage compartment, forming a “grease cap”, there is limited oxygen in the trap. This allows naturally occurring ubiquitous populations of anaerobic bacteria in the trap to predominate. Anaerobic bacteria produce methane, hydrogen sulfide and other foul-smelling gases. This is not only unpleasant to breathe, but these gasses are flammable and damaging to the trap and sewer-system pipes.
While frequent pump-outs of the trap can greatly reduce the odor and clogging problems, there is still the problem of disposing of the accumulated waste contents (oil, grease, settled food particles, and gray water) of the trap. Until recently restaurant operators had the contents of the trap pumped into trucks and hauled to landfills, where it was deposited and allowed to degrade over a period of many years. This method, however, simply relocated the problem to the landfill instead of solving the problem. Because of new regulations introduced into law in October 1993, this method of disposal is no longer available in many places of the US. New methods of waste removal and disposal are therefore being investigated. Among them are the use of enzymes and other emulsifiers, solvents, and saponification agents (Molnaa et al., 1988). The problem with these methods is that they break the oil and grease down into intermediate compounds that may recoagulate or deposit in sewer lines (Molnaa et al.,1988). The process of breaking a compound down to CO2 and H20 is very complex, and can only be accomplished by a living organism through many metabolic steps (Grubbs,1991).
Another possibility for waste removal and disposal is the process of dewatering and reusing the grease and oil to make dog food and cosmetics (All Waste Recycling Co., 1994). However, this process is both time-intensive and expensive when considering the limited amount of grease rendered. The most promising method of treatment for grease traps may be bioremediation.
There has, however, been some question concerning the ability of bioremediation techniques to treat restaurant grease traps effectively for the removal of oil and grease. The principal issue is whether the microorganisms completely metabolize the oil and grease to CO2 and H20, or only to intermediate organic compounds that still have a substantive BOD. These intermediate organic compounds may be small enough that they do not separate out of the water phase, or they may be large enough that they form soaps which clog the pipes (Grubbs et al., 1991). Studies have shown that bacteria are capable of utilizing lipids as a food source and degrading them to carbon dioxide and water (ES&T, 1979; Grubbs, 1991). The effectiveness of the microorganisms to do this is determined by their retention time in contact with the substrate. In a grease trap environment the retention time is minimal, only about 24 hours. It is questionable, then, whether 24 hours is sufficient time for bacteria to completely metabolize grease, oil and other organic substrates in the grease trap.
The purpose of this investigation was to compare four different methods of grease trap waste treatments, and to determine the effectiveness of these grease trap treatments, and to determine the effectiveness of these grease trap treatments in reducing lipids and other organic substrates at a site on the Texas Christian University Campus in Ft. Worth, Texas. Treatment methods include, vacuum pumping, bacterial inoculation, aeration, and a combination of both bacterial inoculation and aeration.
Treatment efficiency or effectiveness is defined as the ability of the treatment to reduce BOD and TSS in the effluent waste water as compared to the original BOD and TSS of the influent waste water. Biochemical oxygen demand was measured as an indicator of the amount of grease, oil and organic matter present in the influent, trap, and effluent. Total suspended solids was measured as an indicator of the amount of organic material in the trap. Influent, trap, and effluent concentrations of ammonia, nitrate, and phosphate were analyzed as additional indicators of microorganism activity. Additionally, BOD, TSS, ammonia, nitrate, phosphate, and dissolved oxygen were monitored throughout the trap chambers to determine what effects the treatments would have inside the grease trap. Particular attention was paid to the changes occurring in chamber 1 because chamber 1 is where the bulk of the grease, oil, and organic particulates are captured. This is also where most of the microbial activity takes place on the organic substrates. It is because of this that the aeration device was added to chamber 1, the bacteria were added there, and where the most physical changes were observed.
Methods and Materials
Experimental Location
The grease trap studied is located on the southwest corner of the Texas Christian University Brown Lupton Student Center in Ft. Worth Texas. The student center cafeteria is open 7 days per week during the school year which lasts from late August to mid-December, and from mid-January to mid-May, re-opening during the summer sessions from June 15 to July 15 and from July 15 to August 15, when the new fall session begins again on August 31. The restaurant’s hours during operation are from 7 am to 7 pm Monday through Thursday, 7 am to 6 pm on Fridays, and 8 am to 6 pm Saturday and Sunday. During the summer the restaurant is open from 8 am to 6 pm Monday through Friday.
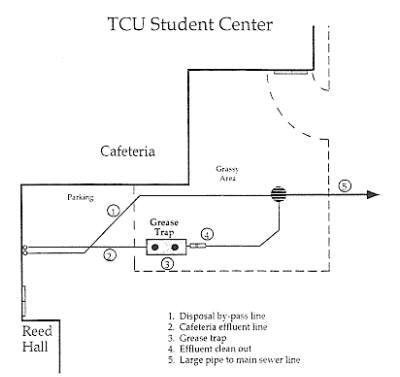
Diagram illustrating the effluent pipes from the student cafeteria, one into the grease trap, the other bypassing the trap.
Approximately 18,000 students are served each week during the school year and 1,000 students are served each week during the summer. The wastewater line from the restaurant to the grease trap collects limited garbage disposal waste, and all floor drains are connected. The floor drains have metal grates so most large food particles are kept out. Most of the garbage disposal waste by-passes the grease trap via a line that reconnects at a three way open canal junction that can be seen when a manhole cover is lifted. The three channels form into one large pipe that connects into the main sewer line approximately 150 yards away.
During Phase I of the study, from 8/13/93 to 8/27/93, the restaurant served 1,000 people per week. During Phase II of the experiment, from 8/27/93 to 9/21/93, restaurant patronage increased to 25,000 people per week and continued to average approximately 20,000 individuals per week through the rest of the experiment, which was terminated on 11/10/93.
Methodology for grease trap sample collection and analysis is divided into three groups:
(1) sample collection and field analysis, (2) laboratory chemical analysis, and (3) trap treatments.
Grease Trap Design
The grease trap studied is a standard 1,000 gallon underground tank that is partitioned by two baffles, the first baffle extending from the top of the trap down to within 12 inches of the bottom of the trap, and the second baffle separated from the first by approximately 4 feet, and extending 4.5 feet upward from the bottom of the trap. This effectively partitions the grease trap into 3 sections, or chambers. From this point, these 3 sections will be referred to as chamber 1, chamber 2, and chamber 3.
Effluent waste water leaving the restaurant enters the grease trap toward the top of the trap and is immediately forced downward through a pipe at a 90 degree angle. This pipe moves the waste water to a box in the bottom of the trap, approximately 2′ x 2′ in size, that slows and mixes the gray water before it is released into chamber 1. Here, food particles and other heavy organic waste settles, and the grease and oil float approximately 4.5 feet to the top of the water column, where it accumulates in the chamber 1 compartment. The slightly clarified water moves under the first baffle into chamber 2, where more particles settle out, and oil and grease residue further accumulate, allowing more clarified water to flow over the top of the second baffle into the third, much smaller compartment, chamber 3 where the last of the grease, oil, and particles are collected and held. This allows the final clarified water to pass out of the trap through a 4 inch hole one foot off the bottom of the trap into a pipe at a 45 degree angle that carries the final waste water to the main sewer.
Residence time in the grease trap was not determined. It is believed, however, that the water takes approximately 24 hours to reach the effluent line of the trap from the influent line (Grubbs, et al 1991).
Sampling Schedule
A sampling schedule was formulated spanning an 87 day period from August 13 to November 10, 1993. Samples were collected consecutively during the first 51 days and collected once a week for the remainder of the sampling period. A total of 62 samples were collected. All samples were collected once a day at 7 am, + / – 30 minutes.
Results and Discussion
Correlation, multiple regression, and linear regression analyses were run on all sets of data to determine which parameters tested were the best indicators or predictors of BOD. Additionally, BOD, TSS, NO3- and NH3 were used as indicators of microbial activity. The following tables and figures represent the influent and effluent concentrations of BOD, TSS, NO3-, and NH3 for each of the treatment phases. All values are given in mg/l.
Treatment I – Pumping the trap:
During the fifteen day sampling period of Treatment I, the BOD of the influent averaged 576.2 mg/1, while the effluent averaged 145 mg/1. This represented a 75% reduction in BOD during Treatment I (Table 1).
Even though BOD fluctuated from day to day in each of the chambers, there was almost always an overall decrease in BOD from chamber 1 to the effluent during the first part of Treatment I. However, on 8/18, grease, oil, and organic matter had built up so much in chamber 3 that this decreasing BOD trend changed. As grease and oil accumulated in chamber 3, the BOD in chamber 3 correspondingly increased to amounts above that in chamber 2. This increase of BOD in chamber 3 gave rise to an increase in BOD in the effluent indicating that the trap was no longer containing the grease and oil.
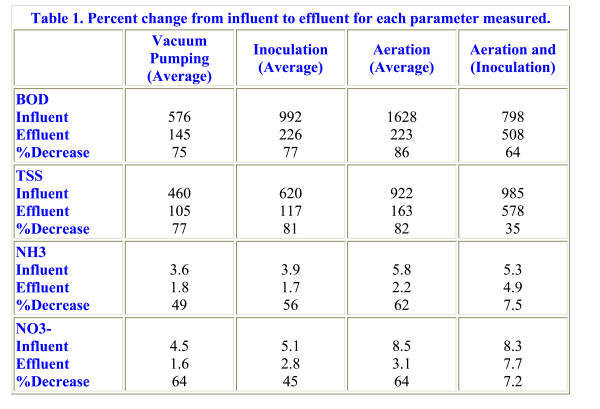
Table 1. Percent change from influent to effluent for each parameter measured.
Total Suspended Solids in the influent averaged 460 mg/l during the fifteen day sampling period. The effluent had an average TSS of 105 mg/l. Therefore, vacuum pumping treatment showed a 77% decrease in TSS from influent to effluent. Total Suspended Solids experienced a similar rise in the effluent due to the build up in chamber 3. Total Suspended Solids was a good predictor of BOD in this case because it measured the concentration of the organic matter or food sources, so that if more total suspended solids are present in a grease trap environment, more food is available for the bacteria, thus increasing the BOD. This positive relationship between BOD and TSS was confirmed through statistical analysis using multiple regressions and correlations.
In addition to organic matter, bacteria require nitrogen for the building of cell mass, (Grubbs, 1994). The amount of NH3 and NO3- present in the trap is an indicator of microbial activity. That is, as microbial activity increases, NH3 and NO3- decrease, causing BOD and TSS to decrease. Both NH3 and NO3- showed the same general decreasing trend throughout the trap. During this phase, the NH3 concentration in the influent averaged 3.6 mg/l, and NO3- concentration averaged 4.5 mg/1. In the effluent NH3 concentration averaged 1.8 mg/1, and NO3- averaged 1.6 mg/l, resulting in a 49% decrease in NH3 and a 64% decrease in NO3′.
Dissolved oxygen levels remained approximately the same in the influent for the fifteen samples obtained. This is because there is a constant amount of dissolved oxygen in the water coming from the kitchens. Wastewater flow leaving the restaurant and entering chamber 1 carried a DO concentration averaging approximately 4.58 mg/1. Chamber 1 had an average DO concentration of approximately 1.5 mg/1. The DO concentration increased steadily through the trap to about 5 mg/1 in the effluent. In chamber 1, however, where most of the organic matter and lipids are retained, a slow decrease in DO over the first four days after the trap was pumped was observed (Figure 6).

Figure 6. Averaged dissolved oxygen concentration (PPM) in the influent and effluent for each treatment.
Also occurring at this time was the build-up of a thick layer of grease and oil over the entire surface of chambers 1 and 2, and a layer of organic particulate matter building up on the floors of chambers 1 and 2. At this point, concentrations of TSS, NH3 and NO3′ were extremely high, at 4,310 mg/1, 11.95 mg/1, and 25 mg/1, respectively. On the fifth day after pumping the trap, the DO level fell to 0.85 mg/1. The anaerobic conditions that developed in chamber 1 probably caused a reduction in aerobic microbial populations, thereby decreasing oxygen demand. During the next two days, DO concentration rose to approximately 2 + 0.5 PPM, where it fluctuated around that concentration for the remainder of the sampling period.
Corresponding to the build-up of the grease cap in chamber 1 and the decline in dissolved oxygen concentration, the odor of hydrogen sulfide and methane became noticeably pungent. During this same period, the grease layer changed from a soft light-yellow colored substance to a clumping, darker tan layer. Also on the fourth day, a dark brown liquid appeared on the top of the grease layer. This brown liquid only remained two days. With the presence of the brown liquid, it was difficult to prevent the more-fluid brown liquid from becoming part of the sample. Therefore, samples obtained from chamber 1 had high BOD concentrations, ranging from approximately 2,900 mg/l to 4,700 mg/1. On the sixth day the grease layer had become lighter in color, and much softer, without the presence of the brown liquid. The BOD concentrations also fell. The liquid had the consistency of emulsified grease or oil. This may indicate that the brown liquid phase was a product of the first stages of grease and oil catabolism, since bacteria begin metabolism outside of the cell by producing surfactants and enzymes that break the larger molecules into smaller ones that can enter the bacteria cell.
Throughout the fifteen day sampling period of the treatment, temperature, pH, conductivity, total dissolved solids, and chemical oxygen demand were also monitored. Temperature and pH, two very important environmental factors, remained within an expectable range for bacterial life processes. Temperature ranged from a one-day high of 46° C in chamber 1 to a low of 31 degrees in the effluent. Conductivity and TDS followed the same pattern, with almost no fluctuation during the fifteen day sampling period. Phosphate showed a tremendous amount of fluctuation during treatment 1, and appeared to be dependent only on the quantity of oven, dish washing, and floor cleaners the kitchen clean-up crews used each evening. Chemical oxygen demand was monitored, with a general decreasing trend from influent to effluent.
Treatment II – Bacterial Inoculation:
Coinciding with bacterial inoculation of the trap, the 1993 TCU Fall semester began. Therefore, BOD levels in the influent, and thus in the other chambers of the trap were significantly higher due to the increased amount of food production in the kitchens. With more organic material entering the trap there was an increased demand on the bacteria to metabolize the excess organic material. The average influent BOD had risen to 992 mg/1. Effluent BOD averaged 226 mg/1. This shows an increase in BOD from 576.2 mg/1, from the time the trap was inoculated due to the beginning of the school year. Because the trap was not pumped at the beginning of treatment II, a layer of organic particulates remained on the floors of chambers 1 and 2. Biochemical Oxygen Demand averages between influent and effluent decreased by 77%, still a 2% lower BOD between influent and effluent than that obtained from pumping alone. During this time all five sections of the trap increased in BOD. Inoculation of the trap resulted in an average TSS decrease of 81% between influent and effluent during the twenty-five days of sampling. This was a 4% better reduction in TSS than pumping the trap at two-week intervals. The average influent TSS was 620 mg/1, decreasing to an average effluent TSS of 117 mg/1. TSS also increased in each section of the trap. There appeared to be limited reduction in organic sediment in the trap, and a noticeable cloudiness remained in the samples obtained from chamber 1 and other parts of the trap. During this treatment period the bacteria performed adequately in their reduction of BOD and TSS (Figures 7 and 8).
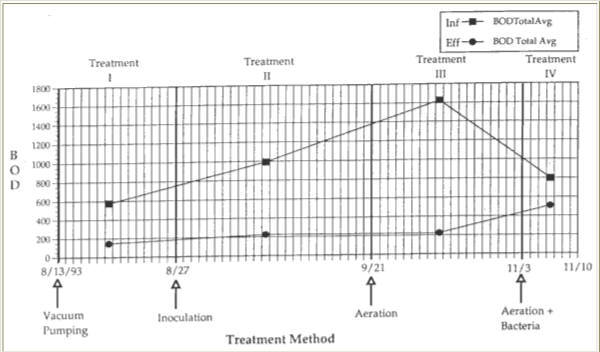
Figure 7. Averaged biochemical oxygen demand (PPM) in the influent and effluent for each treatment.
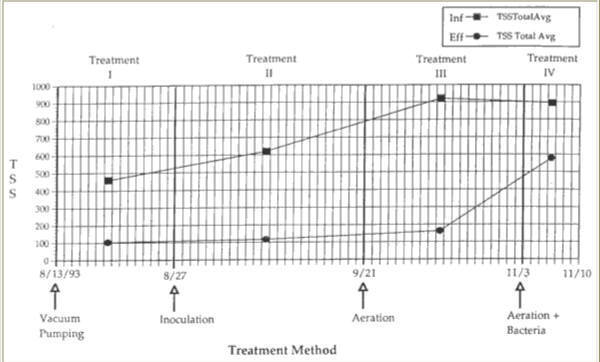
Figure 8. Averaged concentration of total suspended solids (PPM) in the influent and effluent for each treatment.
In the influent and effluent, NH3 and NO3- experienced similar trends. NH3 concentration in the influent averaged 3.9 mg/1, while NO3- averaged 5.1 mg/1. Effluent average of NH3 was 1.7 mg/1, while NO3- was 2.8 mg/1. This translated into a 56% decrease in NH3 and a 45% decrease in NO3′ from influent to effluent. Between Treatment I – vacuum pumping and treatment II -inoculation, however, NO3- decreased by 19% while NH3 increased by 7% (Figures 9 and 10).

Figure 9. Averaged concentration of ammonia (PPM) in the influent and effluent during each treatment.
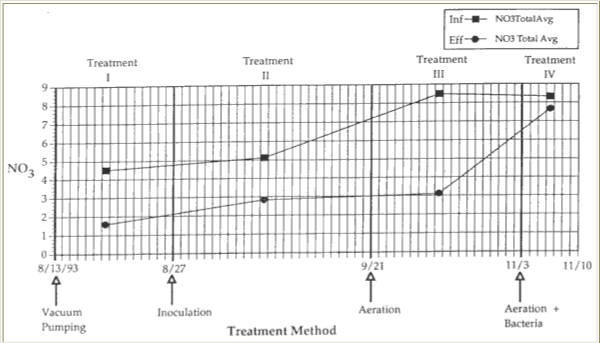
Figure 10. Averaged concentration of nitrate (PPM) in the influent and effluent during each treatment.
This increase in NH3 was probably the result of anaerobic bacterial populations producing NH3 during limited DO cycles in chamber 1. Otherwise, a similar decrease in ammonia and nitrate would have been expected. This is because aerobic bacteria take in NH3 and oxidize it to nitrate in the cell. During this treatment, influent DO remained approximately the same as in the previous treatment at 4.58 mg/1 for Treatment I – vacuum pumping and 4.42 mg/1 for Treatment II – bacterial inoculation. The DO level in chamber 1 dropped slightly from the first treatment, from 1.5 mg/1 to 1.1 mg/1. The DO decreased from Treatment I to Treatment II, from 4.95 mg/1 to 4.25 mg/1 in the effluent (Figure 6). While the dissolved oxygen concentration of the influent remained approximately the same as in treatment I, overall dissolved oxygen levels in chamber 1 fell from an average 1.5 mg/1 before inoculation to an average 1.1 mg/1 during the inoculation treatment phase (Figure 6).
One day after inoculation, the DO concentration in chamber 1 fell to 0.87 mg/l, indicating that the additional bacteria consumed most of the oxygen in the trap. After inoculation, a cycle of high and low DO concentrations became evident.
Every 2-5 days the DO concentration would drop below 1 PPM, and only reached as high as 1.6 PPM. This cycle may represent the rise and fall of aerobic bacterial populations in chamber 1 working on organic waste in the trap and using the remaining oxygen, only to “crash,” allowing influent water to replenish some of the DO concentration before it is used up again.
Also during this time anaerobic populations must have been working as well, because of the physical changes that took place in chamber 1 during the first few days of the treatment II phase. After only four days the brown liquid reappeared and the heavy, dark brown balls of old grease and oil began to soften and change color back to tan. This may indicate that both aerobic and facultative anaerobic bacteria were working together to break the grease cap down. Evidence of this was the physical changes in the grease cap and the reduced BOD and TSS. Additional evidence was the slight increase in NH3 and the increase in nitrate.
The odor had been the strongest yet on the day of inoculation and became only slightly less offensive during this phase of the treatment. Throughout the twenty-five day sampling period of treatment II, temperature, pH, conductivity, and total dissolved solids were also monitored. Chemical oxygen demand was recorded for only 11 days before analysis was terminated due to inconsistencies in the test results. Temperature and pH again remained within an expectable range for bacterial life processes. Temperature ranged from a one-day high of 40°C in chamber 1 to a low of 26 degrees in the effluent. Conductivity and TDS followed the same pattern, with almost no fluctuation during the fifteen day sampling period. Phosphate showed a tremendous amount of fluctuation throughout the trap during treatment II and appeared to be dependent only on the quantity of oven, dish washing, and floor cleaners the kitchen clean up crews used each evening. Chemical oxygen demand was monitored for the first 11 days with some reduction from influent to effluent.
Treatment III – Aeration:
The trap was neither pumped, nor any new bacteria added during this phase of treatment, but a mechanical aeration device was added. Almost immediately after the addition of the aeration device to chamber 1, several significant changes were observed. During this treatment phase, influent BOD, TSS, NH3 and NO3′ all increased dramatically (Figures 7, 8, 9, and 10), due to an additional organic load from the kitchen. The average influent BOD was 1,628 mg/l, while the average effluent BOD was 223 mg/l. This represents an 86% reduction in BOD from the influent to effluent BOD due to aeration of the trap. Chamber 1 BOD and TSS decreased from treatments I and II. In chamber 1 the BOD dropped by 69% from inoculation and by 37% over all. The BOD decreased from influent to effluent by 11% more than treatment I, and by 9% over treatment II.
Aerating the grease trap beginning September 21 resulted in a reduction of TSS from 922 mg/1 in the influent to 163 mg/1 in the effluent. This represents an 82% decrease in TSS over the nineteen day sampling period. As with BOD, TSS dropped by 61% from inoculation and by 24% from vacuum pumping in chamber 1. The TSS in chamber 1 decreased 5% from treatment I and 1% in treatment II. Physical evidence of this decrease occurred within two days of adding the aeration device. After forty-eight hours, organic sediments on the floors of chambers 1 and 2 had completely disappeared, leaving the water almost clear. These physical changes accompanying the aeration of the grease trap significantly reduced both BOD and TBS in chamber 1. More importantly, the aeration device successfully reduced BOD and TBS in chamber 1 under higher input of organic material by the influent.
There was a 62% decrease in NH3 between influent and effluent, from a high average of 5.8 mg/1 to a low average of 2.2 mg/1. NO3′ averages dropped from a high influent average of 8.5 mg/1 to an effluent average of 3.1 mg/1, resulting in a 64% decrease in NO3′. Ammonia also dropped during this treatment phase, by 55% from inoculation and by 44% from vacuum pumping. Nitrate fell by 28% from inoculation in chamber 1, but increased by 21% overall in chamber 1 (Table 1).
Ammonia and NO3- levels were also reduced in chamber 1 due to aeration, because bacteria working in an aerobic environment work faster than those in an anaerobic environment. Average effluent BOD concentration fell by only 4 PPM from treatment II, and increased by 78 PPM from treatment I. Effluent TSS increased over both previous treatments by 58 PPM and 46 PPM, respectively. Additionally, BOD and TSS levels in chambers 2 and 3 increased during this phase. The decrease of BOD and TSS levels in chamber 1, and the increased BOD and TSS levels through chambers 2, 3 and the effluent can be explained by the fact that aerobic organisms work on the organic substrates much faster than anaerobic organisms, consequently producing much more cell mass that drifts through the trap, increasing BOD and TSS concentrations.
The influent DO increased above the first two treatments to 5.3 mg/1 and chamber 1 increased to 3.6 mg/1 from 1.5 mg/1 during Treatment I and 1.12 mg/1 during Treatment II. The effluent dropped to 3.3 mg/1 from 4.95 mg/1 during Treatment I and 4.25 mg/1 during Treatment II. This drop during aeration is another indication of the work and cell production of the bacterial populations.
Because the grease trap was aerated during this phase, dissolved oxygen concentration increased an average of approximately 2.5 PPM over the first two treatments in chamber 1. The aeration device continually added oxygen to chamber 1, thereby eliminating aerobic/anaerobic cycles.
Odor problems were completely eliminated during aeration because anaerobic bacteria do not produce H2S and CH4. The smell of hydrogen sulfide was gone within two days of adding the aeration device. Instead, the trap had the odor of kitchen detergents being washed into the trap. The grease layer changed from the hard, dark brown/black grease balls to a light yellow whipped oil. The bacteria were thus breaking down the grease into intermediates that they can take up through the cell membrane, and metabolize to CO2 and water.
Throughout the twenty day sampling period of treatment III, temperature, pH, conductivity, and total dissolved solids were also monitored. Chemical oxygen demand was not monitored. Temperature and pH again remained within an expected range for bacterial life processes. Temperature ranged from a one-day high of 39°C in chamber 1 to a low of 27°C in the effluent. Conductivity and TDS followed the same pattern, both dropping by half during the twenty day sampling period. Phosphate again showed a tremendous amount of fluctuation throughout the trap during treatment III, but dropped significantly from influent to effluent.
Treatment IV – Aeration and Inoculation:
During treatment IV the same bacteria used for treatment II were re-introduced into the trap, which had been aerating now for 43 days. The average BOD of the influent decreased relative to the third treatment, to 798 mg/l. The average effluent BOD increased relative to all other treatments, to 508 mg/1. This resulted in a much smaller, 64% decrease in BOD (Figure 7). TSS in the influent averaged 895 mg/1, while the effluent averaged 578 mg/1. This resulted in a 35% decrease in TSS from influent to effluent (Figure 8; Table 1). Biochemical Oxygen Demand and TSS fell dramatically by 65% and 71% respectively in chamber 1. In chamber 1, BOD also fell by 44% from aeration alone. As with BOD, chamber 1 TSS fell by an additional 61% from aerating alone, and by 71% when pumping every two weeks.
Ammonia concentration in the influent averaged 5.3 mg/l, and 4.9 mg/1 in the effluent, yielding a 7.5% decrease. Similarly, a 7.2% decrease in NO3- concentration occurred, from an influent average of 8.3 mg/1 to an effluent average of 7.7 mg/1. When aerating alone, in chamber 1 ammonia fell by 28%. Nitrate also fell by 52%, as compared to a 42% decrease when the trap was vacuum pumped alone (Table 1).
Ammonia and nitrate also fell significantly by 60% and 42% in chamber 1. These observed sharp drops indicate a tremendous amount of microbial activity in chamber 1. As expected, large amounts of cell mass were produced and pushed through the trap into the effluent, thus registering as increased BOD, TSS, NO3-, and NH3. Because the bacteria oxidized the NH3 to NO3-, there was a 16% higher concentration of NO3′ than NH3in the effluent.
The DO in the influent increased again to 5.5 mg/1 and the DO in chamber 1 dropped slightly to 3.0 mg/1. The DO concentration in the effluent fell again to 2.4 mg/1. Dissolved oxygen decreased in the effluent by 26% due to the higher amounts of the above parameters (Figure 6). In chamber 1, dissolved oxygen levels decreased by 19% due to increased catabolism and metabolism of organic substrates in chamber 1.
Odor was eliminated in chamber 1 due to inoculation and aeration of the trap. A very soft, much smaller grease layer remained in chamber 1 throughout this treatment phase. The water in chamber 1 remained clear until the last sampling day, when it appeared only slightly cloudy. A strong odor, however, was evident in chamber 3 and the effluent. This odor, reminiscent of sewer water or a park restroom, was accompanied by a thicker “grease like layer” in chamber 3, and a very dark gray water phase with black precipitate in the effluent sample. These unusual results are probably due to a purging or “flushing” of the grease trap system, (Grubbs, 1994). By adding so much bacteria, as well as aerating the trap, recalcitrant substances that had probably been depositing in the trap since it was installed ten years ago were dislodged and moved down line. Decomposition of amines, diamines, mercaptans, sulfides, and the chemical oxidation of grease probably produced the black precipitate and “toilet water” odor characteristic of this phase of treatment, (Grubbs, 1994). The black suspended material found in the first two effluent samples disappeared by the third sample several days later, because the purging of the system was complete. Also by the third sample odor was completely gone and clarity returned.
Conclusion
It was determined that TSS and NH3 were the two best predictors of BOD in the grease trap, and that ammonia and nitrate were good indicators of microbial activity. It should be noted that while effluent BOD, TSS and other parameters are important to track, it is also important to monitor percent change between influent and effluent when comparing methods of treatment. Treatment I – pumping the trap showed the lowest effluent parameters. However, treatment II (bacterial inoculation) and treatment III (microbubble-aeration) both resulted in a larger percent change or decrease between influent and effluent in all of the important tests. This was a significant finding because it proved the effectiveness of these treatments as legitimate methods for the removal of BOD, TSS and nitrogen in the grease trap environment. Even with the slower-working anaerobic bacteria in treatment II there was still a significant removal rate that was comparable to having a grease trap pumped every two weeks. This is also important since many restaurants wait three months or more to have their traps pumped.
Treatment III – Aeration, resulted in the largest reduction of all parameters measured. Aeration increased oxygen and ubiquitous aerobic bacterial populations, and softened and greatly reduced the grease cap, thus completely eliminating odor and clarifying the water. Aerating the grease trap created a mini-waste water treatment plant environment. The results show that this type of treatment works extremely well in eliminating BOD, TSS, NO3′ and NH3, which are important contributors to water pollution (Vesilind, et al., 1990). However, it is not a passive system. That is, aeration of the trap requires wiring the aeration unit from the trap to an electrical source. This is, however, a negligible requirement when considering the greater elimination of BOD, TSS, NO3-, and NH3 that an Aerob-A-Jet aeration system provides, and thus the greater benefit to the local waste water treatment facilities and city authorities.
Treatment IV showed less percent reduction in all the parameters measured as well as higher effluent measurements. However, given the results of aeration and inoculation alone, keeping in mind that the higher effluent readings were due to purging or “flushing” of the system and increased cell production, it can be assumed that a combination of both aeration and bacterial inoculation treatments, with smaller bacterial inoculations of appropriate bacterial species, can significantly reduce the loads on local waste-water treatment facilities. (Grubbs 1994) demonstrated that bioaugmentation of a grease trap is an effective means of eliminating grease and oil. In bioaugmentation, a dominant bacterial species that has a distinct affinity for the substrate in the trap was added to an environment in which it will out-compete other bacteria. It was first added in higher dosages to give it a competitive advantage over other species, then in smaller amounts as it becomes the dominant species. The bacteria added may or may not be a naturally occurring species in a particular grease trap. In this method, it was therefore not only the number of bacteria added, but also the quality of the bacteria.
Before this research began, there had been clogs in both the grease trap effluent line and the restaurant effluent line that bypassed the grease trap (King, 1993). These clogs occurred approximately every few months. During the four treatments of this study, clogs continued to occur in the effluent bypass line, but not in the trap effluent line. This further demonstrated the effectiveness of each of the four treatments in The above results illustrate the fact that there is sufficient retention time in the grease trap environment for bioremediation to be effective when the trap environment is augmented using aeration and specific bacteria. Water cycles through the trap every 24 hours, washing most of the bacteria out of the environment. This short retention time poses a problem for anaerobic bacteria that require more time to metabolize organic material retained in chamber 1. Aerobic bacteria in an oxygenated environment, on the other hand, are able to sufficiently metabolize organic matter within a 24 hour period. Aeration of the trap, combined with a mechanism that allows both a longer retention time of the aerobic bacteria in the trap, as well as plating the bacteria in direct contact with the organic material, would be an increased benefit because the aerobic bacteria would be capable of metabolizing even more of the organic matter much more efficiently and effectively. This type of wastewater pretreatment translates into lower BOD, TSS, NH3, and NO3′ concentrations in the restaurant grease trap effluent, and greatly reduces the organic load that the waste water treatment authorities have to manage. This therefore decreases energy usage and costs to the treatment plant and increases the life of the treatment facility.
Finally, the results of treatment IV raises the question of whether increased BOD or TSS levels are always undesirable. Without question, dumping organic matter with high BOD and TSS levels into a receiving water can have adverse consequences. However, if the BOD and TSS is the result of increased cell mass moving down a sewer line, this may only serve to increase the amount of time the organisms have to work on the substrate in the water phase, as well as on the inside of the sewer lines before it reaches the wastewater treatment facility.